EUR/USD
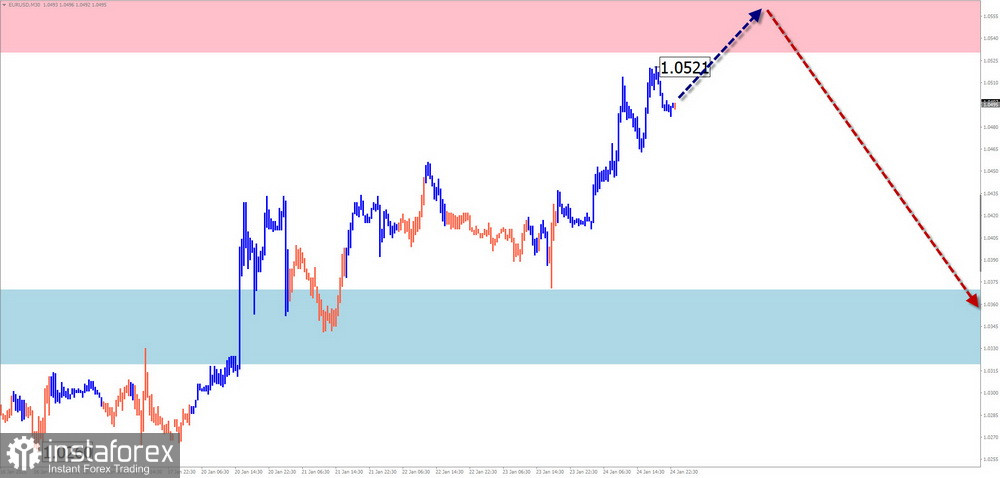
Analysis:Since August last year, the major EUR/USD pair has been in a dominant downtrend. The price decline brought quotes to the upper boundary of a potential large-scale reversal zone. Since the beginning of the year, a corrective bullish wave in the form of an extended flat has been developing, which is not yet complete. A short-term pullback is likely needed within its structure.
Forecast:In the coming week, EUR/USD is expected to trade sideways within nearby counter-directional zones. Initial days may see upward pressure and a brief breach of the upper resistance boundary. A decline is likely in the latter half of the week, but not beyond the lower boundary of the price channel.
Potential Reversal Zones:
- Resistance: 1.0530/1.0580
- Support: 1.0370/1.0320
Recommendations:
- Buy: No favorable conditions for buying EUR/USD are currently present.
- Sell: Consider selling after reversal signals within intraday sessions using fractional volume sizes. Close trades at the first signs of a reversal.
USD/JPY
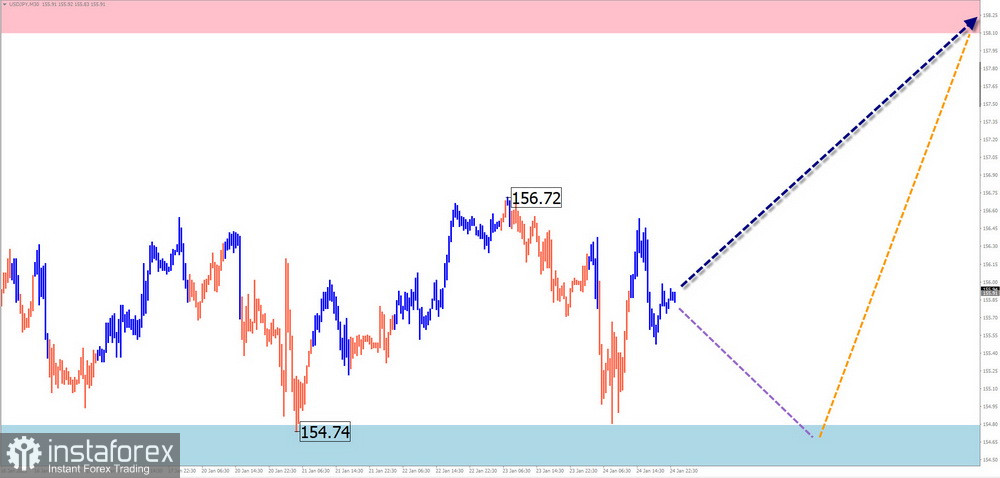
Analysis:The incomplete wave structure of USD/JPY aligns with the global uptrend that started in early August last year. Since December, the pair has been forming a sideways counter-correction. The wave level shows high potential, exceeding the size of the most recent bullish wave's pullback.
Forecast:The first half of the week is likely to see sideways movement within the price channel between opposing zones. A mild downward bias is possible in the initial days, with increased volatility and renewed price growth anticipated toward the weekend.
Potential Reversal Zones:
- Resistance: 158.10/158.60
- Support: 154.80/154.30
Recommendations:
- Sell: High risk; could result in account losses.
- Buy: Consider buying after confirmed reversal signals within the resistance zone using reduced volume sizes.
GBP/JPY
Analysis:The current downward wave for GBP/JPY began in late December. Over the last two weeks, the mid-section (B) of this wave has been forming as an extended flat. The pair is approaching the upper boundary of a significant potential reversal zone.
Forecast:In the coming days, expect upward movement toward the calculated resistance level. Toward the end of the week, heightened volatility may lead to a price decline toward the support boundaries. A temporary breach of the upper resistance boundary cannot be ruled out during trend reversals.
Potential Reversal Zones:
- Resistance: 195.00/195.50
- Support: 192.50/192.00
Recommendations:
- Buy: Short-term trades with small volume sizes are possible within individual sessions.
- Sell: Consider selling after reversal signals in the resistance zone.
USD/CAD
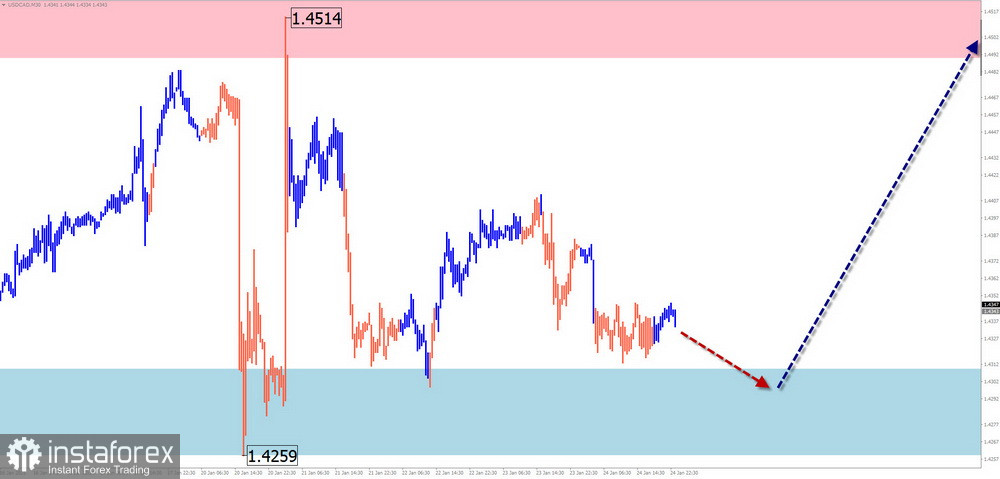
Analysis:Over recent years, the Canadian dollar's trend has been dictated by an upward wave. The ongoing wave since September 25 has been moving sideways for over a month. A corrective flat has been developing within the wave structure over the last two weeks. While the structure appears complete, no confirmed reversal signals are present.
Forecast:USD/CAD is expected to move along calculated support levels throughout the week. Toward the end of the week, price growth may resume, but gains are unlikely to exceed the resistance zone.
Potential Reversal Zones:
- Resistance: 1.4490/1.4540
- Support: 1.4310/1.4260
Recommendations:
- Buy: Possible after confirmed reversal signals near the support area.
- Sell: Allowed with reduced volume sizes in individual sessions, but potential is limited to the calculated support.
NZD/USD
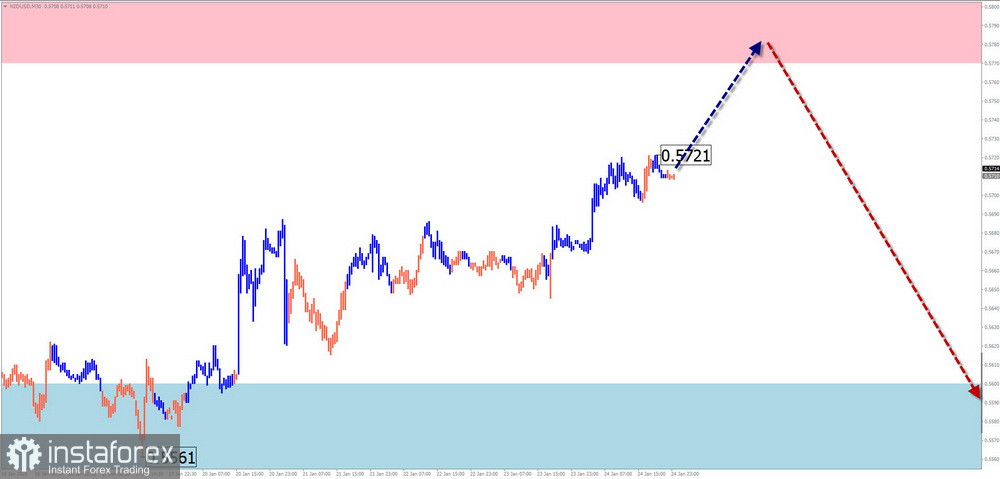
Analysis:Since late September, the NZD/USD chart has been forming a downward impulse. In December, a counter-correction (B) began as an extended flat. This structure remains incomplete, and the pair is approaching the lower boundary of a large-scale potential reversal zone.
Forecast:Movements in the upcoming days are expected to mirror last week's trends. The upward movement may continue until the calculated resistance zone is reached. Toward the weekend, the likelihood of a reversal and downward movement toward support levels increases.
Potential Reversal Zones:
- Resistance: 0.5770/0.5820
- Support: 0.5600/0.5550
Recommendations:
- Sell: Potentially attractive after reversal signals near the resistance zone.
- Buy: Possible with fractional volumes in individual sessions, but upward potential is limited to resistance.
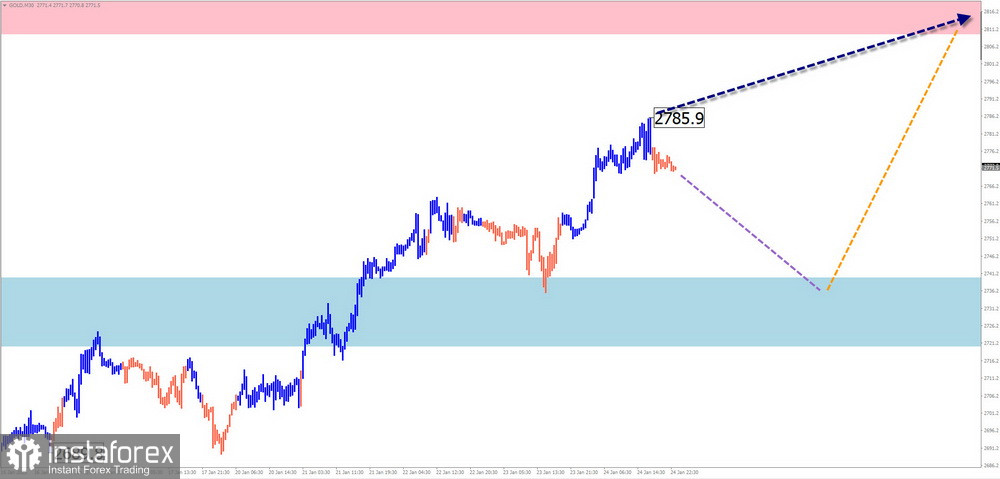
Gold
Analysis:After a corrective period in the fall, the gold chart is forming a new bullish zigzag wave. Currently, the final segment (C) is developing. Following last week's break above intermediate resistance, gold needs to consolidate at these levels.
Forecast:The first few days of the week may see a downward flat, lasting until midweek. Afterward, expect a surge in volatility, a trend reversal, and resumed active growth toward resistance levels. These events will likely coincide with key economic news releases.
Potential Reversal Zones:
- Resistance: 2810.0/2830.0
- Support: 2740.0/2720.0
Recommendations:
- Sell: Risky and may result in losses.
- Buy: Consider buying after confirmed signals near the support zone in your trading system.
Explanation:In simplified wave analysis (SWA), all waves consist of three parts (A-B-C). The analysis focuses on the latest incomplete wave across all timeframes. Dotted lines represent expected movements.
Note: The wave algorithm does not account for the time duration of price movements!