empty
27.01.2025 08:07 AM
EUR/USD and GBP/USD on January 27 - Technical Analysis of the Situation

EUR/USD

This image is no longer relevant

Higher Timeframes

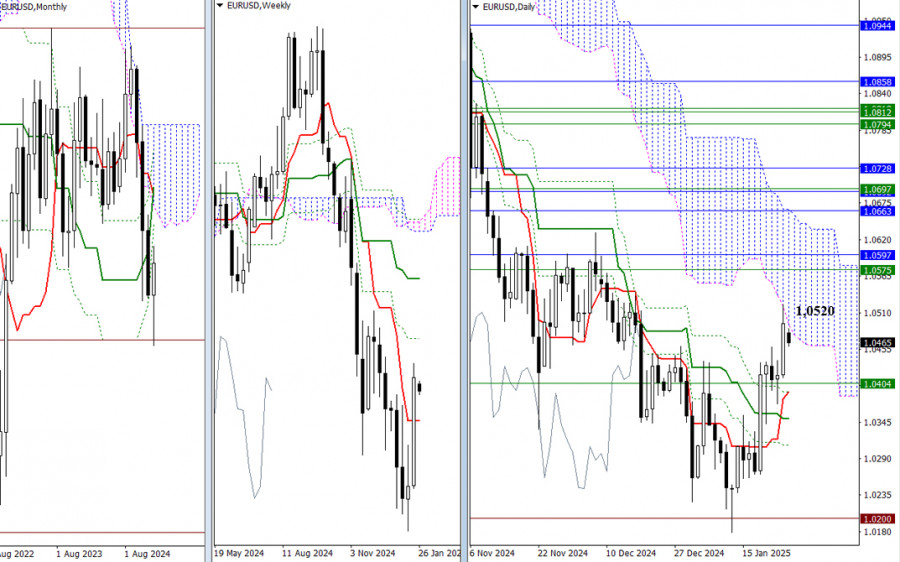
By the end of last week, the bulls successfully tested the lower boundary of the daily Ichimoku cloud at 1.0520. To maintain their gains and create new opportunities, they need to overcome the current resistance and penetrate the daily cloud. The next targets for further growth are the levels from the weekly timeframe at 1.0575 and the monthly timeframe at 1.0597. However, it's important to note that a downward gap formed at the market's opening today. Bullish scenarios should only be considered after the gap is closed and the price stays above the current levels. In the meantime, bears might use this gap to strengthen their positions and push the pair lower. The nearest downside targets are in the zone of 1.0404 to 1.0391, which aligns with both the weekly short-term trend and the daily short-term trend.

This image is no longer relevant

H4 – H1

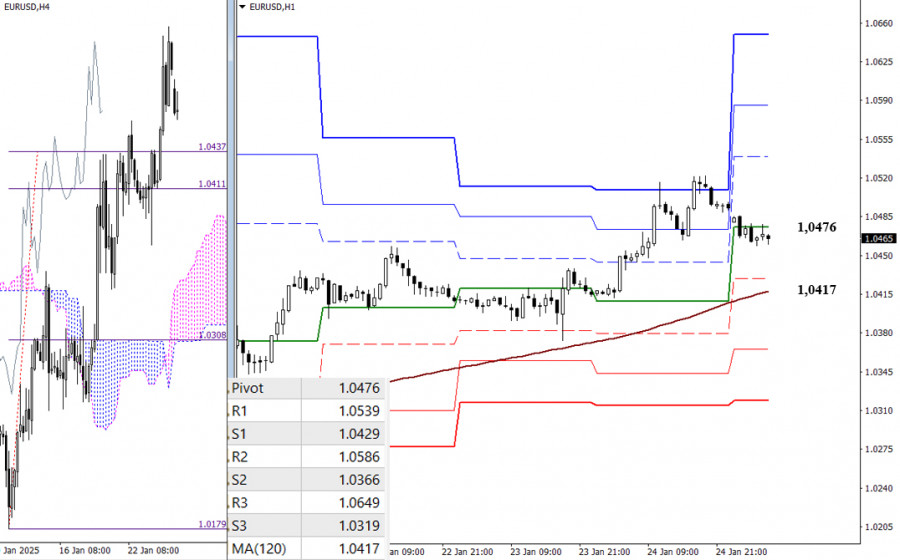
Currently, bulls have the upper hand on lower timeframes. However, the pair is experiencing a corrective downward movement, influenced by the daily central Pivot Point at 1.0476. If this correction continues, the market could test the weekly long-term trend at 1.0417, which plays a crucial role in determining the balance of power. A breakout and reversal of this trend could lead to stronger bearish momentum. Additional intraday support levels, based on classic Pivot Points, are found at 1.0429, 1.0366, and 1.0319. Resistance levels are identified at 1.0539, 1.0586, and 1.0649.

***

GBP/USD

This image is no longer relevant

Higher Timeframes

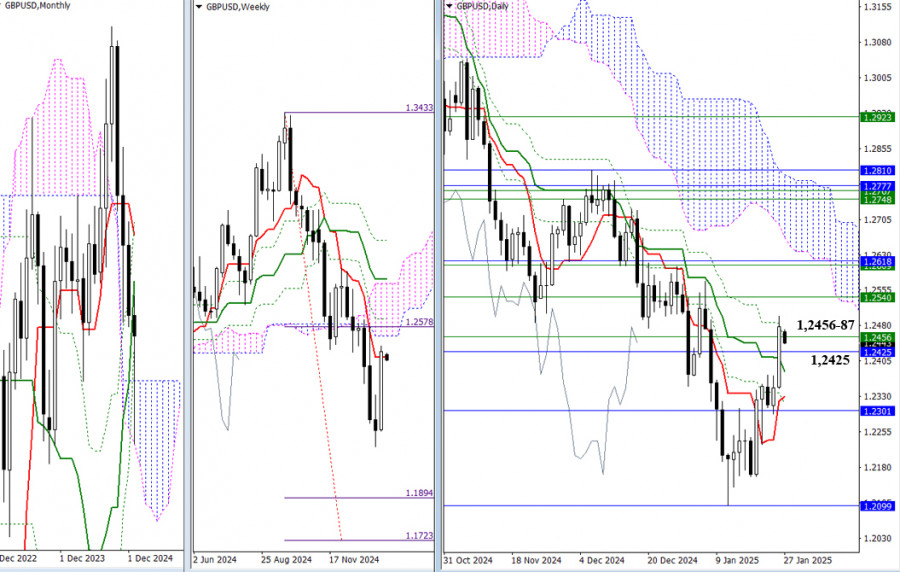
The final trading week of January has begun, raising the question of whether the bulls can maintain the long lower shadow on the monthly candlestick. If conditions remain favorable, they might even turn the candle body bullish. Last week, the pair experienced a corrective rise toward the resistance levels of 1.2425, 1.2456, and 1.2487. Breaking through these levels would enable the bulls to achieve key objectives: eliminate the daily dead cross and secure support from the weekly short-term trend. Conversely, if a rebound occurs from the resistance, the bears will likely target the monthly Ichimoku cloud, with its upper boundary at 1.2301. To do this, they will need to break through the support of the daily cross at 1.2382 and 1.2330.

This image is no longer relevant

H4 – H1

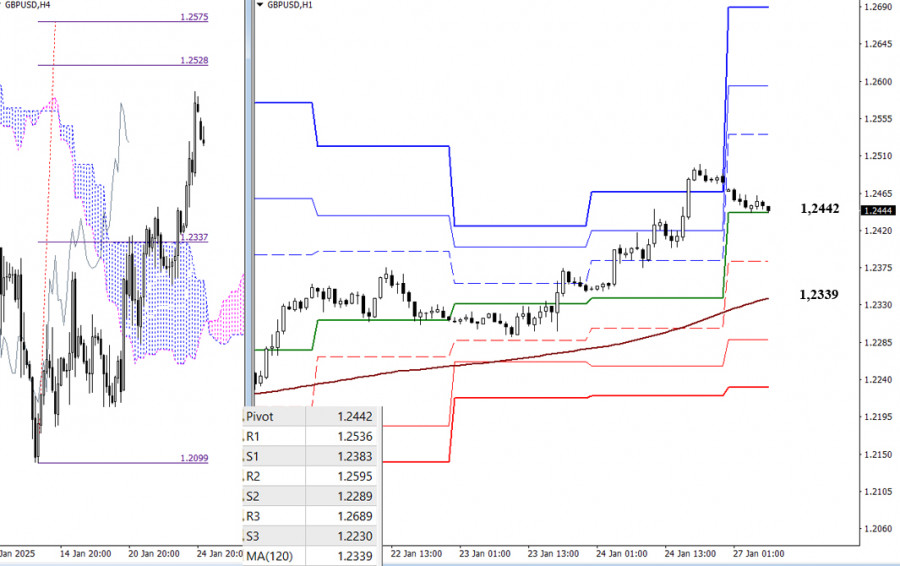
On the lower timeframes, the bulls have the main advantage. Their intraday targets include the classic Pivot Point resistance levels at 1.2536, 1.2595, and 1.2689, as well as the breakout target of the H4 Ichimoku cloud located between 1.2528 and 1.2575.

If the current correction deepens, the bears will aim to break below the central Pivot Point at 1.2442 and move toward the weekly long-term trend level at 1.2339. A break of this level would give the bears a significant advantage on the lower timeframes. Additional bearish targets for the day are the classic Pivot Point support levels at 1.2383, 1.2289, and 1.2230.

***

Technical Analysis Components:
  • Higher Timeframes: Ichimoku Kinko Hyo (9.26.52) and Fibonacci Kijun levels
  • H1: Classic Pivot Points and 120-period Moving Average (weekly long-term trend)
Pilih carta masa
5
min
15
min
30
min
1
jam
4
jam
1
hari
1
minggu
Jana pendapatan melalui perubahan kadar mata wang kripto dengan InstaForex.
Muat turun MetaTrader 4 dan buka dagangan pertama anda.
  • Grand Choice
    Contest by
    InstaForex
    InstaForex always strives to help you
    fulfill your biggest dreams.
    SERTAI PERADUAN

Artikel yang dicadangkan

EUR/USD – 12 Februari: Powell Mengesahkan Pendirian Agresif FOMC

Pada hari Selasa, EUR/USD berbalik memihak euro sekitar paras anjakan semula Fibonacci 23.6% pada 1.0288 dan mula bergerak naik semula. Pergerakan menaik berjaya menolak pasangan mata wang ini ke paras

Samir Klishi 10:43 2025-02-12 UTC+2

EUR/USD dan GBP/USD 12 Februari – Analisis Teknikal Situasi

Satu lagi jurang ke bawah telah ditutup, dan pasangan ini telah kembali ke tahap trend jangka pendek mingguan (1.0357). Sebagai tambahan kepada Tenkan mingguan, Ichimoku harian turut mempengaruhi bahagian carta

Evangelos Poulakis 10:40 2025-02-12 UTC+2

GBP/USD – 12 Februari: Semua Tumpuan Pada Laporan Inflasi A.S.

Pada carta setiap jam, GBP/USD beralih memihak kepada pound di bawah zon sokongan 1.2363 – 1.2370 dan memulakan pergerakan menaik baharu menuju zon rintangan 1.2488 – 1.2508. Malangnya, tiada lantunan

Samir Klishi 10:31 2025-02-12 UTC+2

Ramalan EUR/USD untuk 12 Februari 2025

Dalam ucapan semalam di Dewan Perwakilan, Jerome Powell tidak memberikan sebarang maklumat baharu, mengulangi bahawa tiada keperluan segera untuk pemotongan kadar. Selain itu, Indeks Harga Pengguna (CPI) AS yang dijangka

Laurie Bailey 08:30 2025-02-12 UTC+2

Ramalan GBP/USD untuk 12 Februari 2025

Pada penghujung sesi dagangan semalam, GBP/USD mencatatkan kenaikan sebanyak 77 pip. Bertentangan dengan jangkaan, harga tidak mengukuh di bawah paras 1.2367, sebaliknya berjaya mengukuh di atasnya selepas menguji paras tersebut

Laurie Bailey 08:21 2025-02-12 UTC+2

Ramalan AUD/USD untuk 12 Februari 2025

Pada hari Isnin, dolar Australia mengukuh di atas tahap 0.6273, mengesahkan momentum kenaikan harga. Sasaran seterusnya ditetapkan pada 0.6351, dan penembusan di atas tahap ini boleh membuka pergerakan menuju 0.6482

Laurie Bailey 08:21 2025-02-12 UTC+2

Ramalan Bitcoin untuk 12 Februari 2025

Bitcoin (BTC) Pada carta harian, Bitcoin menghadapi kesukaran untuk melepasi garis penunjuk keseimbangan (purata bergerak merah), menunjukkan bahawa peserta pasaran lebih cenderung untuk menjual. Pengayun Marlin terus menurun dalam kawasan

Laurie Bailey 08:21 2025-02-12 UTC+2

Analisis Teknikal Pergerakan Harga Intraday Instrumen Komoditi Gas Asli, Rabu 12 Februari 2025.

Terdapat dua perkara menarik pada carta 4 jam instrumen komoditi Gas Asli (#NG). Pertama, kemunculan corak Rising Wedge, dan kedua, perbezaan antara pergerakan harga #NG dan penunjuk Pengayun Stochastic. Kedua-dua

Arief Makmur 07:59 2025-02-12 UTC+2

Analisis Teknikal Pergerakan Harga Harian Pasangan Mata Wang Silang AUD/JPY, Rabu 12 Februari 2025.

Pada carta 4-jam, pasangan mata wang silang AUD/JPY kelihatan mempunyai corak Descending Broadening Wedge dan terdapat penyelewengan antara pergerakan harga AUD/JPY dan penunjuk Awesome Oscillator. Oleh itu, berdasarkan dua maklumat

Arief Makmur 07:59 2025-02-12 UTC+2

Isyarat Dagangan EMAS (XAU/USD) untuk 11-15 Februari 2025: beli di atas $2,880 (SMA 21 - lantunan semula)

Sebaliknya, jika emas mencapai rintangan pada 2,932 dalam beberapa jam akan datang, ia boleh dianggap sebagai peluang untuk menyambung semula kedudukan jual, kerana dari segi teknikal, kita melihat keletihan dalam

Dimitrios Zappas 16:21 2025-02-11 UTC+2
Tidak boleh bertanya sekarang?
Tanya soalan anda di Ruangan bersembang.
Panggilan semula Widget
 

Dear visitor,

Your IP address shows that you are currently located in the USA. If you are a resident of the United States, you are prohibited from using the services of InstaFintech Group including online trading, online transfers, deposit/withdrawal of funds, etc.

If you think you are seeing this message by mistake and your location is not the US, kindly proceed to the website. Otherwise, you must leave the website in order to comply with government restrictions.

Why does your IP address show your location as the USA?

  • - you are using a VPN provided by a hosting company based in the United States;
  • - your IP does not have proper WHOIS records;
  • - an error occurred in the WHOIS geolocation database.

Please confirm whether you are a US resident or not by clicking the relevant button below. If you choose the wrong option, being a US resident, you will not be able to open an account with InstaForex anyway.

We are sorry for any inconvenience caused by this message.