empty
27.01.2025 01:07 PM
Forecast for EUR/USD on January 27, 2025

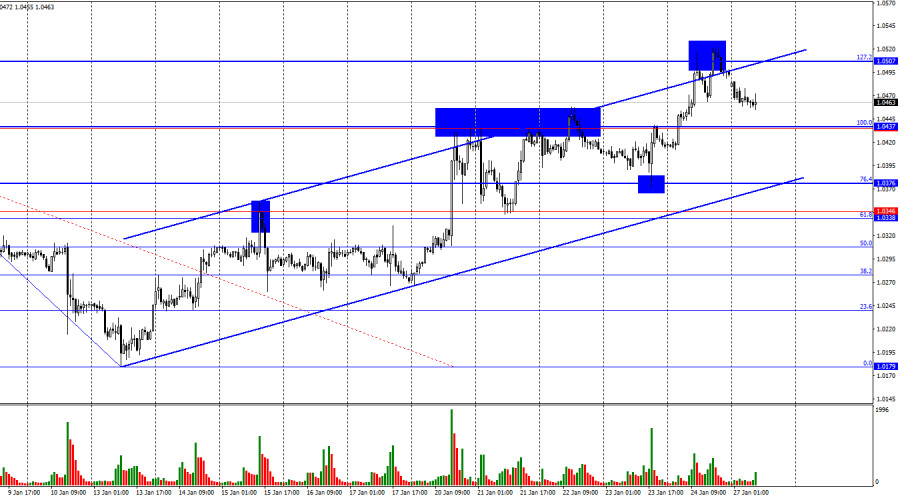
On Friday, the EUR/USD pair continued its upward movement, consolidating above the 100.0% Fibonacci retracement level at 1.0437 and testing the 127.2% Fibonacci level at 1.0507. A rebound from this level worked in favor of the U.S. dollar, leading to a decline toward the 1.0437 level. The upward trend channel confirms the bullish sentiment in the market.

This image is no longer relevant

The situation with the waves remains clear. The last completed downward wave broke the low of the previous wave, while the latest upward wave (still incomplete) has surpassed the previous two peaks. This confirms the completion of the bearish trend. A new downward wave could soon begin forming, but for the bears to establish a new trend, the price needs to return to the 1.0179 level or form a more complex wave structure that takes control.

The information flow on Friday was favorable for the bulls but not outstanding. I believe bullish traders exceeded expectations for both Friday and the entire past week. The euro appreciated too significantly, considering the informational backdrop, which was mostly absent on most days. By information background, I mean economic data. However, it's possible the market was trading "on Trump." If so, trader sentiment will soon depend on this factor.

On Friday, Germany's business activity indices delivered better-than-expected results, as did those for the Eurozone. U.S. indices were also decent but fell short of their European counterparts. Additionally, the University of Michigan Consumer Sentiment Index came in weaker than traders expected. While the dollar's decline was justified, it was overly strong.

This week will be pivotal, with the ECB and Federal Reserve meetings on the agenda. ECB President Christine Lagarde will deliver speeches almost daily, and news from Donald Trump will likely continue to flood in. Thus, there will be ample news, and its influence on trader sentiment will be significant.

This image is no longer relevant

4-Hour Chart Analysis:

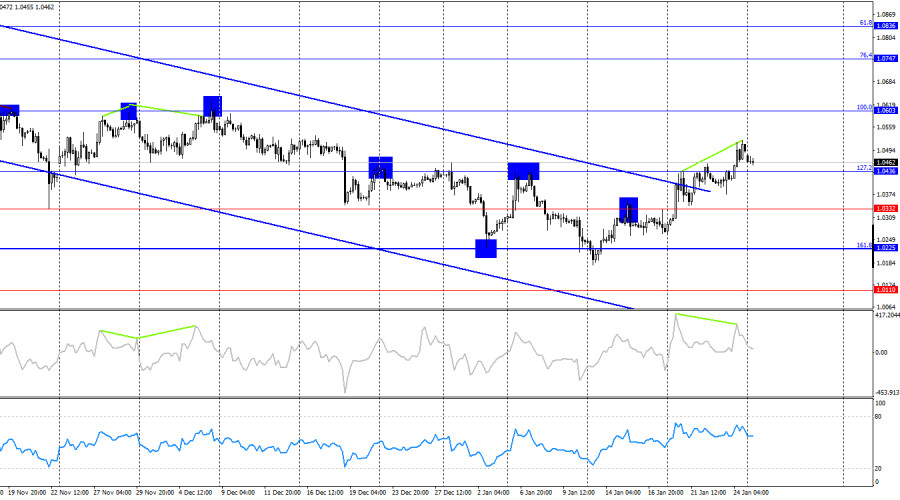
On the 4-hour chart, the pair consolidated above the 127.2% Fibonacci retracement level at 1.0436. This suggests that the upward movement could continue toward the next Fibonacci level of 100.0% at 1.0603. The euro has also broken above the downward trend channel, indicating a gradual shift to a bullish trend. However, how long this bullish trend will last remains unclear. A bearish divergence on the CCI indicator signals a potential decline in the near term.

Commitments of Traders (COT) Report:

This image is no longer relevant

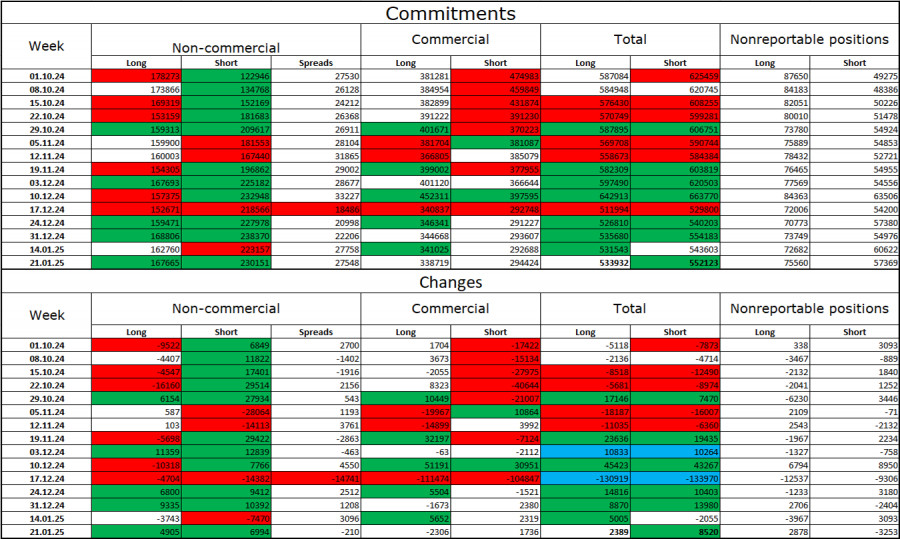
In the latest reporting week, professional players opened 4,905 long positions and 6,994 short positions. The sentiment of the "Non-commercial" group remains bearish, suggesting a potential continuation of the pair's decline. The total number of long positions held by speculators now stands at 167,000, while short positions amount to 230,000.

For 18 consecutive weeks, major players have been selling the euro. This signifies a bearish trend without exception. While bulls occasionally dominate for individual weeks, these instances are exceptions rather than the rule. The key driver of the dollar's weakness—expectations of monetary policy easing by the Federal Reserve—has already been priced in. Unless new reasons to sell the dollar emerge, the U.S. currency's recovery remains more likely.

News Calendar for the U.S. and Eurozone:

  • Eurozone: ECB President Christine Lagarde's Speech (15:35 UTC).

On January 27, the economic calendar contains just one notable event, but it is significant enough to moderately impact market sentiment.

EUR/USD Forecast and Recommendations for Traders:

  • Sales: Selling the pair is advisable after consolidation below the upward trend channel on the hourly chart.
  • Purchases: Buying opportunities were available after a rebound from the 1.0336–1.0346 zone, targeting 1.0435–1.0448, and this target has already been reached. New buying opportunities arise upon a bounce from the 1.0437 level on the hourly chart, targeting 1.0507.

Fibonacci levels are plotted from 1.0437–1.0179 on the hourly chart and from 1.0603–1.1214 on the 4-hour chart.

Samir Klishi,
Analytical expert of InstaForex
© 2007-2025
Select timeframe
5
min
15
min
30
min
1
hour
4
hours
1
day
1
week
Earn on cryptocurrency rate changes with InstaForex
Download MetaTrader 4 and open your first trade
  • Grand Choice
    Contest by
    InstaForex
    InstaForex always strives to help you
    fulfill your biggest dreams.
    JOIN CONTEST

Recommended Stories

EUR/USD – February 11th: Trump Begins a New Dangerous Game

On Monday, the EUR/USD pair rallied towards the 1.0335 – 1.0346 resistance zone, rejected it, and reversed in favor of the U.S. dollar, dropping to the 23.6% Fibonacci retracement level

Samir Klishi 11:53 2025-02-11 UTC+2

GBP/USD – February 11: Powell and Bailey to Determine Market Direction on Tuesday

On the hourly chart, the GBP/USD pair confirmed a breakout below the 1.2363 – 1.2370 support zone on Monday, suggesting a potential further decline toward the 261.8% corrective level

Samir Klishi 11:42 2025-02-11 UTC+2

Forex forecast 11/02/2025: EUR/USD, USD/CAD, Oil and Bitcoin

Useful links: My other articles are available in this section InstaForex course for beginners Popular Analytics Open trading account Important: The begginers in forex trading need to be very careful

Sebastian Seliga 10:47 2025-02-11 UTC+2

EUR/USD Forecast for February 11, 2025

On Monday, the price closed the morning gap and confirmed a daily candle close below the MACD line, reinforcing the primary scenario of a move toward the 1.0135 support level

Laurie Bailey 10:38 2025-02-11 UTC+2

GBP/USD Forecast for February 11, 2025

On the daily chart, the GBP/USD pair has moved below the 1.2367 support level, simultaneously confirming a daily candle close below the MACD line. This movement coincided with the Marlin

Laurie Bailey 10:36 2025-02-11 UTC+2

USD/JPY Forecast for February 11, 2025

On Monday, the USD/JPY pair corrected from the 151.30 support level but is starting today's session with a downward movement. The Marlin oscillator is still rising. A situation of free

Laurie Bailey 10:31 2025-02-11 UTC+2

Silver Forecast for February 11, 2025

After a minor pullback from the breached target level of 32.280, the price is once again attempting to break above it, this time seemingly with confirmation. The Marlin oscillator

Laurie Bailey 10:22 2025-02-11 UTC+2

Technical Analysis of Intraday Price Movement of Silver Commodity Instrument, Tuesday February 11, 2025.

From what is seen on the 4-hour chart, the Silver commodity instrument appears to have a Bullish 123 pattern followed by a Bullish Ross Hook (RH) where all of this

Arief Makmur 09:32 2025-02-11 UTC+2

Technical Analysis of Intraday Price Movement of Crude Oil Commodity Instrument, Tuesday February 11, 2025

Although the Crude Oil commodity instrument on the 4-hour chart is still under seller pressure, the appearance of the Bullish 123 pattern followed by the Bullish Ross Hook (RH), especially

Arief Makmur 09:32 2025-02-11 UTC+2

EUR/USD Analysis – February 10th

On Friday, the EUR/USD pair rebounded from the 61.8% Fibonacci retracement level at 1.0411, followed by a decline toward the 23.6% Fibonacci level at 1.0288. The rebound from this level

Samir Klishi 17:45 2025-02-10 UTC+2
Can't speak right now?
Ask your question in the chat.
Widget callback
 

Dear visitor,

Your IP address shows that you are currently located in the USA. If you are a resident of the United States, you are prohibited from using the services of InstaFintech Group including online trading, online transfers, deposit/withdrawal of funds, etc.

If you think you are seeing this message by mistake and your location is not the US, kindly proceed to the website. Otherwise, you must leave the website in order to comply with government restrictions.

Why does your IP address show your location as the USA?

  • - you are using a VPN provided by a hosting company based in the United States;
  • - your IP does not have proper WHOIS records;
  • - an error occurred in the WHOIS geolocation database.

Please confirm whether you are a US resident or not by clicking the relevant button below. If you choose the wrong option, being a US resident, you will not be able to open an account with InstaForex anyway.

We are sorry for any inconvenience caused by this message.