empty
27.01.2025 08:07 AM
EUR/USD and GBP/USD on January 27 - Technical Analysis of the Situation

EUR/USD

This image is no longer relevant

Higher Timeframes

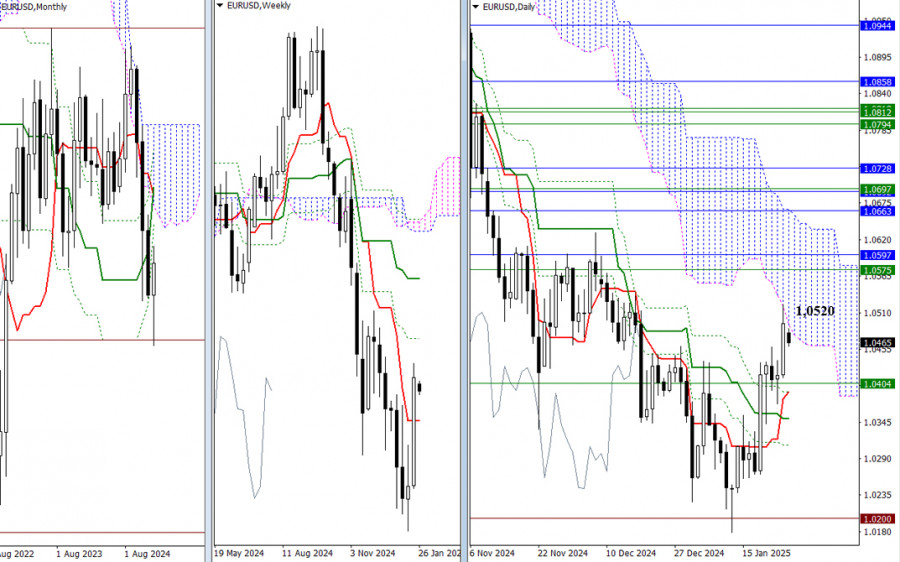
By the end of last week, the bulls successfully tested the lower boundary of the daily Ichimoku cloud at 1.0520. To maintain their gains and create new opportunities, they need to overcome the current resistance and penetrate the daily cloud. The next targets for further growth are the levels from the weekly timeframe at 1.0575 and the monthly timeframe at 1.0597. However, it's important to note that a downward gap formed at the market's opening today. Bullish scenarios should only be considered after the gap is closed and the price stays above the current levels. In the meantime, bears might use this gap to strengthen their positions and push the pair lower. The nearest downside targets are in the zone of 1.0404 to 1.0391, which aligns with both the weekly short-term trend and the daily short-term trend.

This image is no longer relevant

H4 – H1

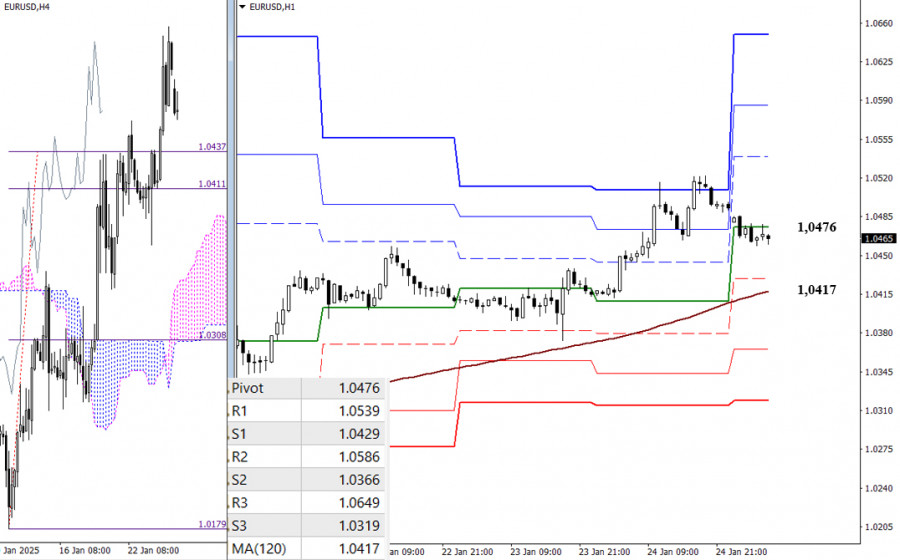
Currently, bulls have the upper hand on lower timeframes. However, the pair is experiencing a corrective downward movement, influenced by the daily central Pivot Point at 1.0476. If this correction continues, the market could test the weekly long-term trend at 1.0417, which plays a crucial role in determining the balance of power. A breakout and reversal of this trend could lead to stronger bearish momentum. Additional intraday support levels, based on classic Pivot Points, are found at 1.0429, 1.0366, and 1.0319. Resistance levels are identified at 1.0539, 1.0586, and 1.0649.

***

GBP/USD

This image is no longer relevant

Higher Timeframes

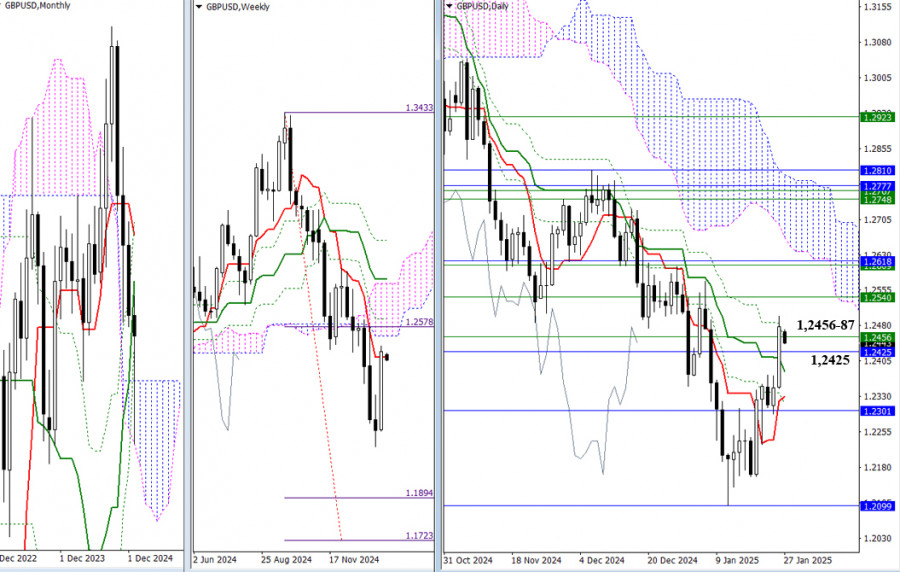
The final trading week of January has begun, raising the question of whether the bulls can maintain the long lower shadow on the monthly candlestick. If conditions remain favorable, they might even turn the candle body bullish. Last week, the pair experienced a corrective rise toward the resistance levels of 1.2425, 1.2456, and 1.2487. Breaking through these levels would enable the bulls to achieve key objectives: eliminate the daily dead cross and secure support from the weekly short-term trend. Conversely, if a rebound occurs from the resistance, the bears will likely target the monthly Ichimoku cloud, with its upper boundary at 1.2301. To do this, they will need to break through the support of the daily cross at 1.2382 and 1.2330.

This image is no longer relevant

H4 – H1

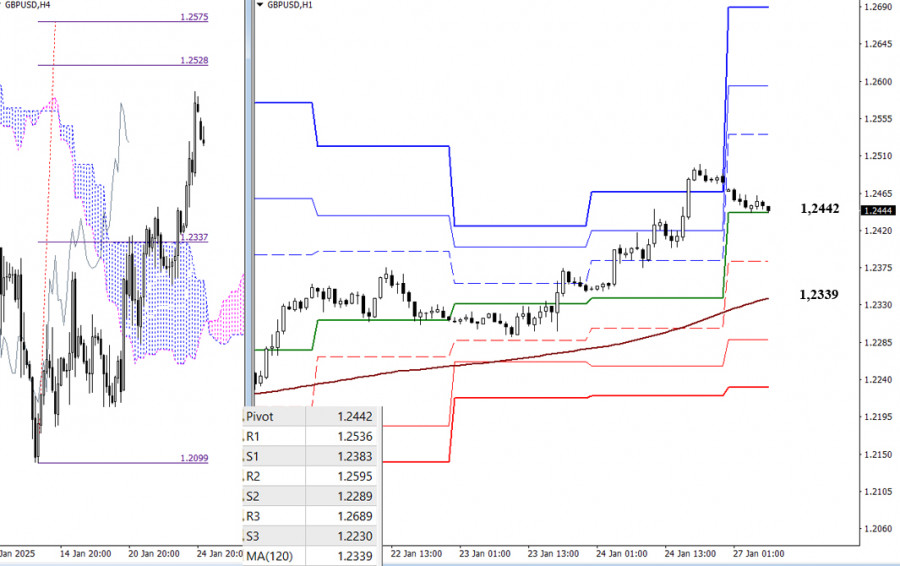
On the lower timeframes, the bulls have the main advantage. Their intraday targets include the classic Pivot Point resistance levels at 1.2536, 1.2595, and 1.2689, as well as the breakout target of the H4 Ichimoku cloud located between 1.2528 and 1.2575.

If the current correction deepens, the bears will aim to break below the central Pivot Point at 1.2442 and move toward the weekly long-term trend level at 1.2339. A break of this level would give the bears a significant advantage on the lower timeframes. Additional bearish targets for the day are the classic Pivot Point support levels at 1.2383, 1.2289, and 1.2230.

***

Technical Analysis Components:
  • Higher Timeframes: Ichimoku Kinko Hyo (9.26.52) and Fibonacci Kijun levels
  • H1: Classic Pivot Points and 120-period Moving Average (weekly long-term trend)
Evangelos Poulakis,
Analytical expert of InstaForex
© 2007-2025
Select timeframe
5
min
15
min
30
min
1
hour
4
hours
1
day
1
week
Earn on cryptocurrency rate changes with InstaForex
Download MetaTrader 4 and open your first trade
  • Grand Choice
    Contest by
    InstaForex
    InstaForex always strives to help you
    fulfill your biggest dreams.
    JOIN CONTEST

Recommended Stories

EUR/USD – February 11th: Trump Begins a New Dangerous Game

On Monday, the EUR/USD pair rallied towards the 1.0335 – 1.0346 resistance zone, rejected it, and reversed in favor of the U.S. dollar, dropping to the 23.6% Fibonacci retracement level

Samir Klishi 11:53 2025-02-11 UTC+2

GBP/USD – February 11: Powell and Bailey to Determine Market Direction on Tuesday

On the hourly chart, the GBP/USD pair confirmed a breakout below the 1.2363 – 1.2370 support zone on Monday, suggesting a potential further decline toward the 261.8% corrective level

Samir Klishi 11:42 2025-02-11 UTC+2

Forex forecast 11/02/2025: EUR/USD, USD/CAD, Oil and Bitcoin

Useful links: My other articles are available in this section InstaForex course for beginners Popular Analytics Open trading account Important: The begginers in forex trading need to be very careful

Sebastian Seliga 10:47 2025-02-11 UTC+2

EUR/USD Forecast for February 11, 2025

On Monday, the price closed the morning gap and confirmed a daily candle close below the MACD line, reinforcing the primary scenario of a move toward the 1.0135 support level

Laurie Bailey 10:38 2025-02-11 UTC+2

GBP/USD Forecast for February 11, 2025

On the daily chart, the GBP/USD pair has moved below the 1.2367 support level, simultaneously confirming a daily candle close below the MACD line. This movement coincided with the Marlin

Laurie Bailey 10:36 2025-02-11 UTC+2

USD/JPY Forecast for February 11, 2025

On Monday, the USD/JPY pair corrected from the 151.30 support level but is starting today's session with a downward movement. The Marlin oscillator is still rising. A situation of free

Laurie Bailey 10:31 2025-02-11 UTC+2

Silver Forecast for February 11, 2025

After a minor pullback from the breached target level of 32.280, the price is once again attempting to break above it, this time seemingly with confirmation. The Marlin oscillator

Laurie Bailey 10:22 2025-02-11 UTC+2

Technical Analysis of Intraday Price Movement of Silver Commodity Instrument, Tuesday February 11, 2025.

From what is seen on the 4-hour chart, the Silver commodity instrument appears to have a Bullish 123 pattern followed by a Bullish Ross Hook (RH) where all of this

Arief Makmur 09:32 2025-02-11 UTC+2

Technical Analysis of Intraday Price Movement of Crude Oil Commodity Instrument, Tuesday February 11, 2025

Although the Crude Oil commodity instrument on the 4-hour chart is still under seller pressure, the appearance of the Bullish 123 pattern followed by the Bullish Ross Hook (RH), especially

Arief Makmur 09:32 2025-02-11 UTC+2

EUR/USD Analysis – February 10th

On Friday, the EUR/USD pair rebounded from the 61.8% Fibonacci retracement level at 1.0411, followed by a decline toward the 23.6% Fibonacci level at 1.0288. The rebound from this level

Samir Klishi 17:45 2025-02-10 UTC+2
Can't speak right now?
Ask your question in the chat.
Widget callback
 

Dear visitor,

Your IP address shows that you are currently located in the USA. If you are a resident of the United States, you are prohibited from using the services of InstaFintech Group including online trading, online transfers, deposit/withdrawal of funds, etc.

If you think you are seeing this message by mistake and your location is not the US, kindly proceed to the website. Otherwise, you must leave the website in order to comply with government restrictions.

Why does your IP address show your location as the USA?

  • - you are using a VPN provided by a hosting company based in the United States;
  • - your IP does not have proper WHOIS records;
  • - an error occurred in the WHOIS geolocation database.

Please confirm whether you are a US resident or not by clicking the relevant button below. If you choose the wrong option, being a US resident, you will not be able to open an account with InstaForex anyway.

We are sorry for any inconvenience caused by this message.